


 26 / 82

ı
26
ı
Stock G.L.A. of MERLIN as of 31 December
2015 amounts to 1,865,487 sqm. Stock as of
31 December 2014 amounted to 680,046
sqm, resulting in an increase of the stock in
2015 of 1,184,123 sqm, out of which 997,853
sqm correspond to Testa acquisition and the
remaining to the 48 assets acquired in 2015.
Occupancy rate as of 31 December 2015 is
94.6%.
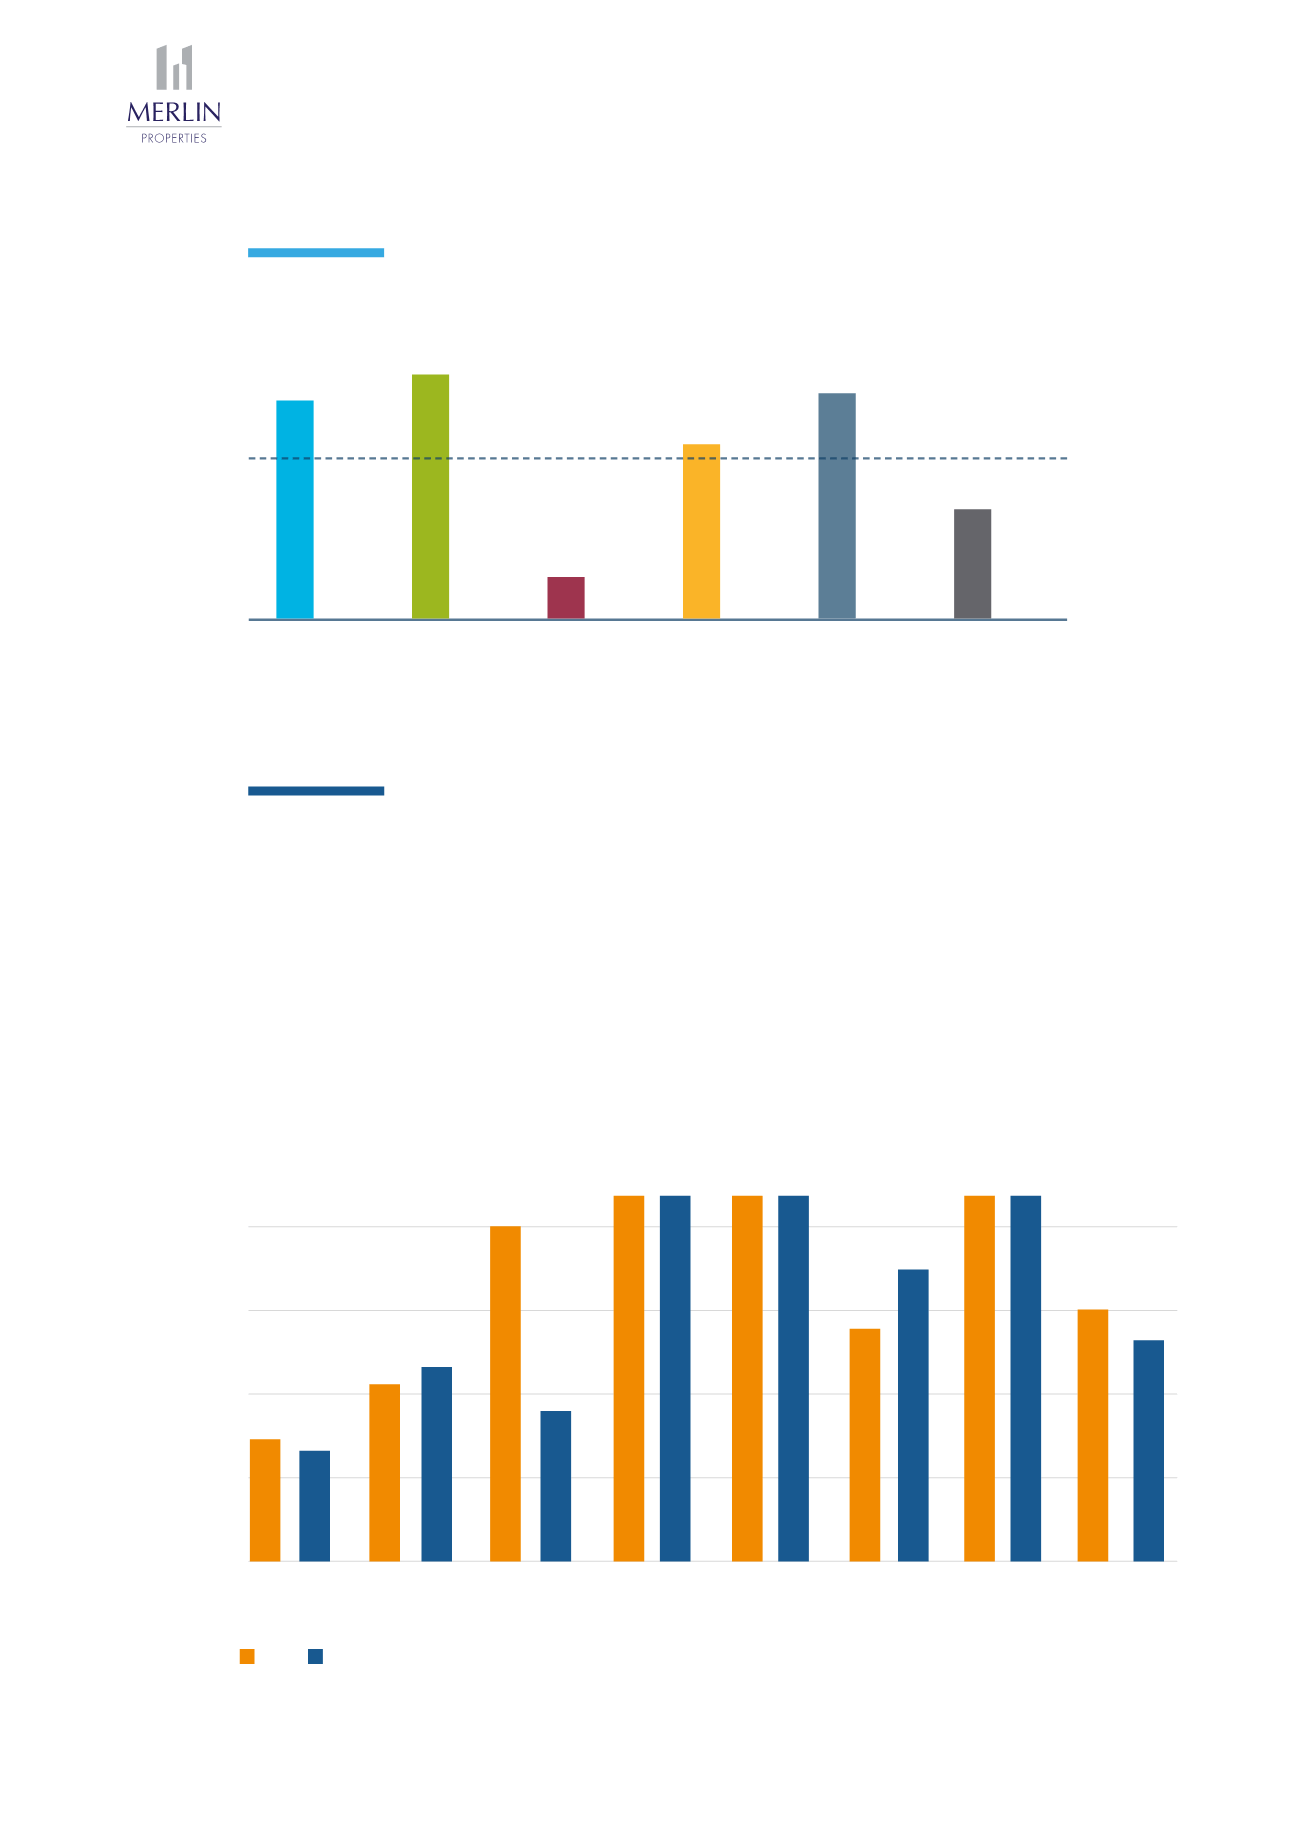
Occupancy evolution on a like-for-like basis,
adjusted to exclude changes in the stock
GLA, is as follows
OCCUPANCY
(1)
Excluding other income (ie. rent guarantees, or mall income in shopping centers)
(2)
Excluding turn-key projects
Average Passing Rent
(1)
(€/sqm/month)
18.3
20.4
15.9
18.3
3.7
8.4
14.1
MERLIN
average
High Street
retail
Hotels
Logistics
(2)
Shopping
centers
Office
Rented
residential
Office
89.7%
90.1%
Shopping
centers
93.2%
92.4%
Logistics
91,4%
98.8%
High Street
Retail
100% 100%
Hotels
100% 100%
Other
100% 100%
MERLIN
94.2%
95.4%
Rented
residential
97.1%
94.8%
2015
2014